Aperture synthesis radar imaging
Radar interferometry with multiple antenna baselines has been performed at Jicamarca, and high-resolution aperture-synthesis images of field-aligned plasma irregularities in the electrojet, the valley region, and in equatorial spread F have been constructed from the data. The images represent the brightness distribution of the coherent radar backscatter which is the Fourier transform of the visibility or spatial cross correlation of the scattered radar signal on the ground.
The visibility data are noisy and incompletely sampled, and we have used a maximum entropy method to perform the Fourier transform, making optimal use of the data available. Using the current antenna configuration at Jicamarca, the radar imaging technique is able to resolve structures within the radar beam that are a few tenths of a degree or less wide. By animating sequences of images, we can observe the evolution of ionospheric irregularities without confusing spatial and temporal variations.

|
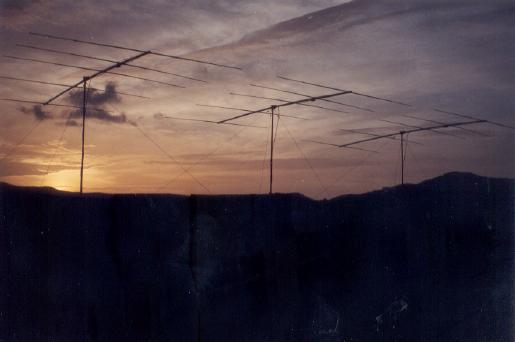
A special antenna module (h) at Jicamarca, physically separated from the main antenna array, provides interferometry baselines up to about 94 wavelengths in length for imaging. Using eight antenna modules for reception, 28 interferometry baselines can be sampled. The antenna configuration used for routine imaging experiments at Jicamarca is shown here. Transmission is typically performed using just the (h) antenna module. |
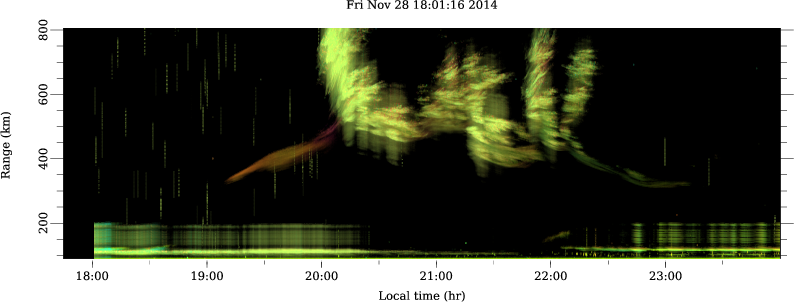
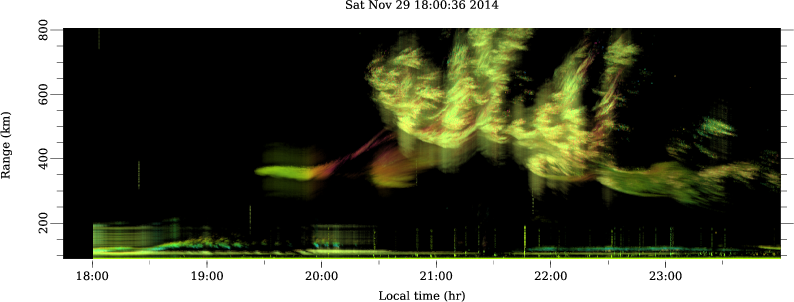
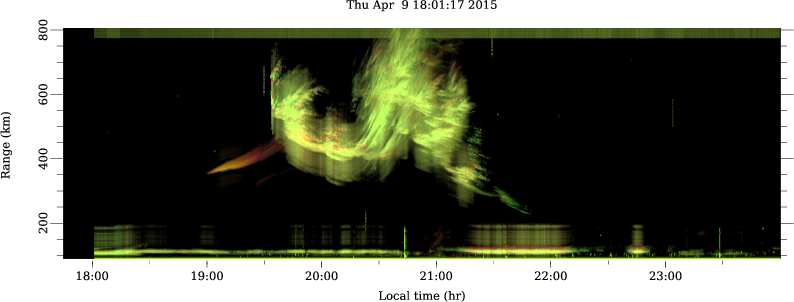
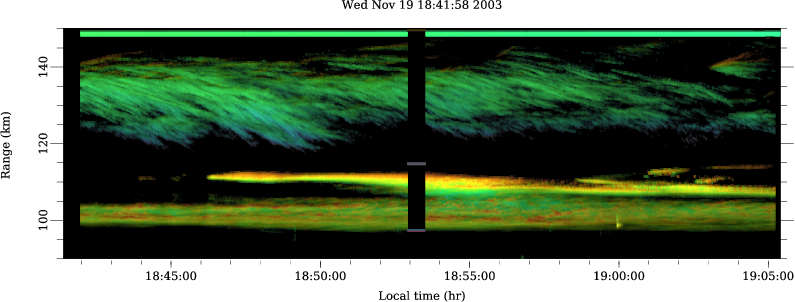
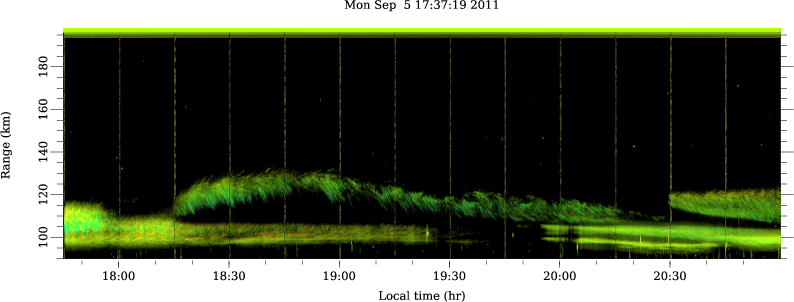
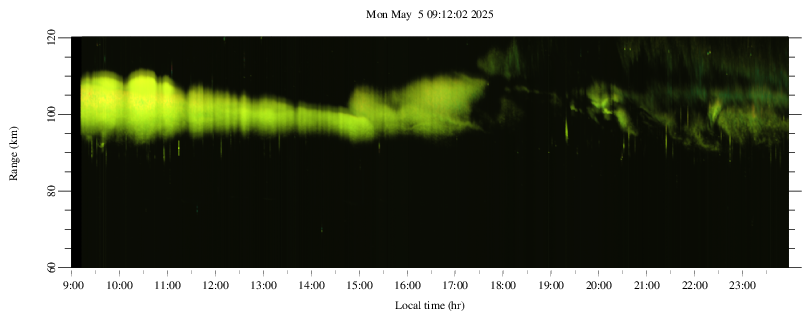
Although the imaging computations are three-dimensional in practice, images of backscatter from field-aligned irregularities can be represented in 2D. The horizontal axes in the images shown below represent zenith angle in the equatorial plane in degrees. The vertical axes represent altitude. In the images, the lightness, hue, and saturation of the pixels represent the S/N ratio, Doppler shift, and spectral width of the backscatter. Red (blue) shifted echoes have red (blue) tones; pure colors denote narrow spectra while broad spectra are pastel.
RTI representation
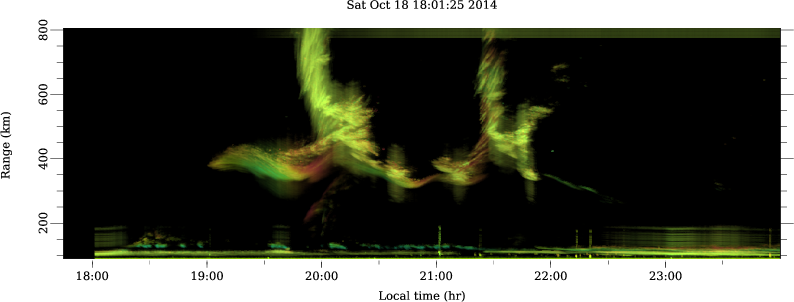
Radar imagery