Zeman Lab Radar
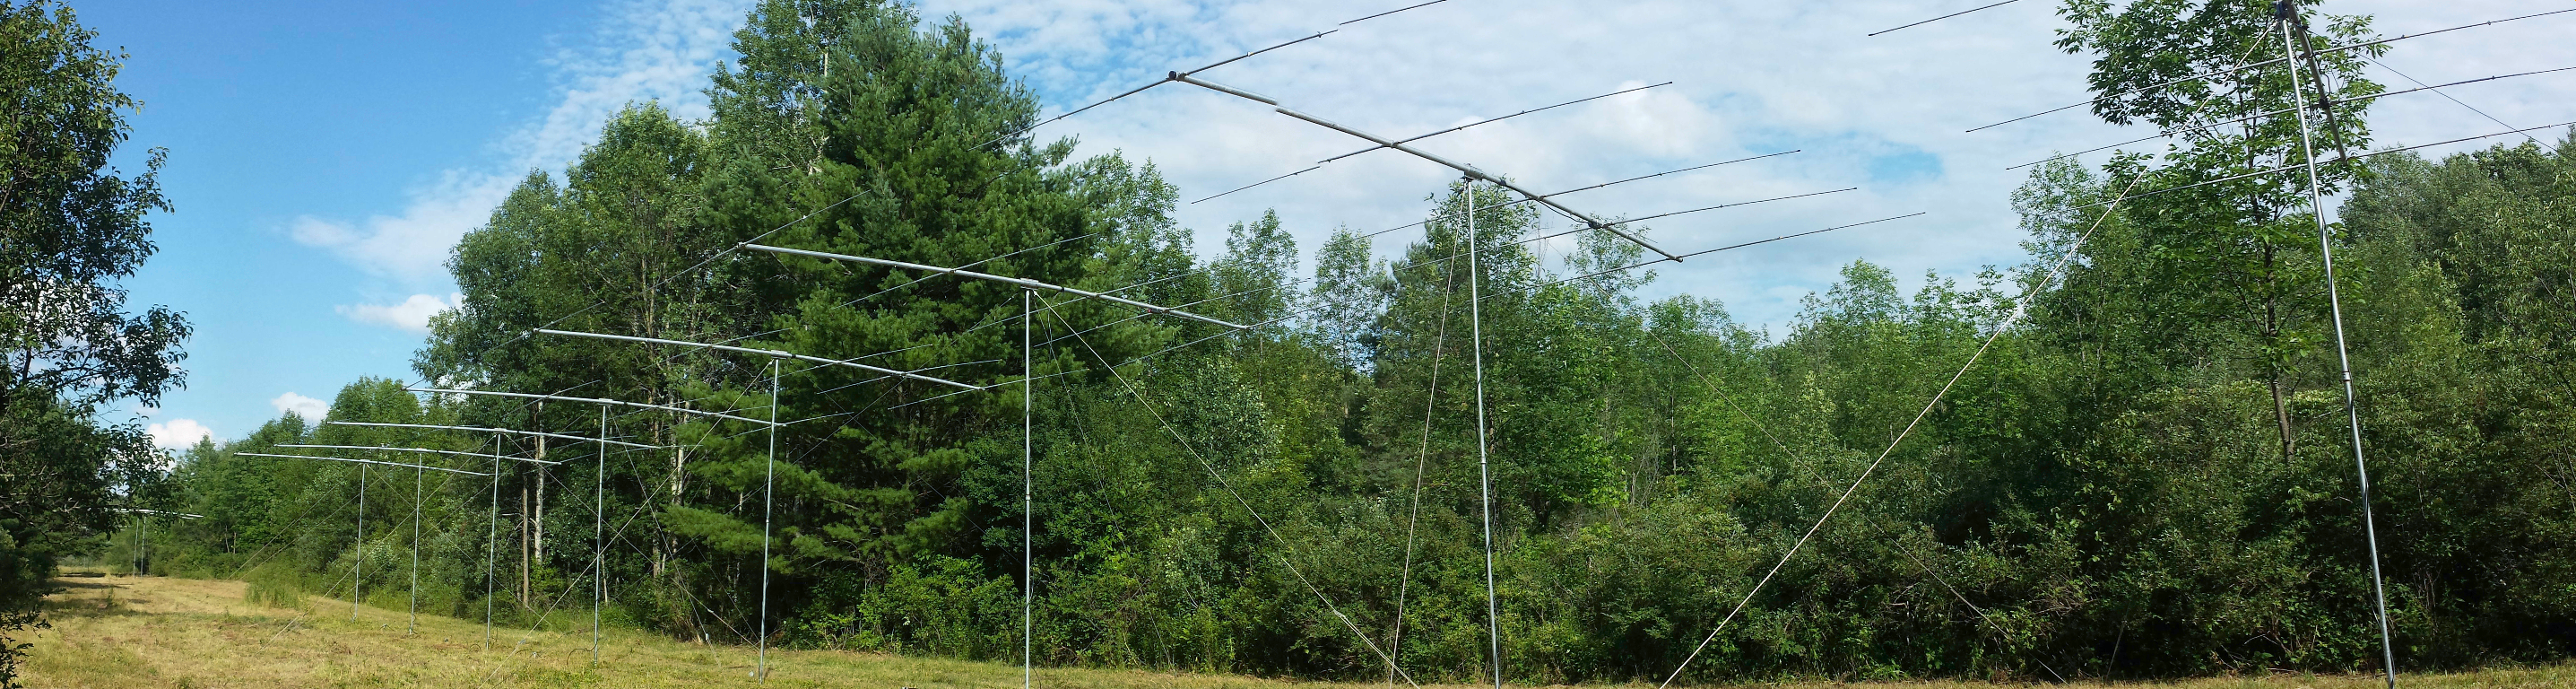
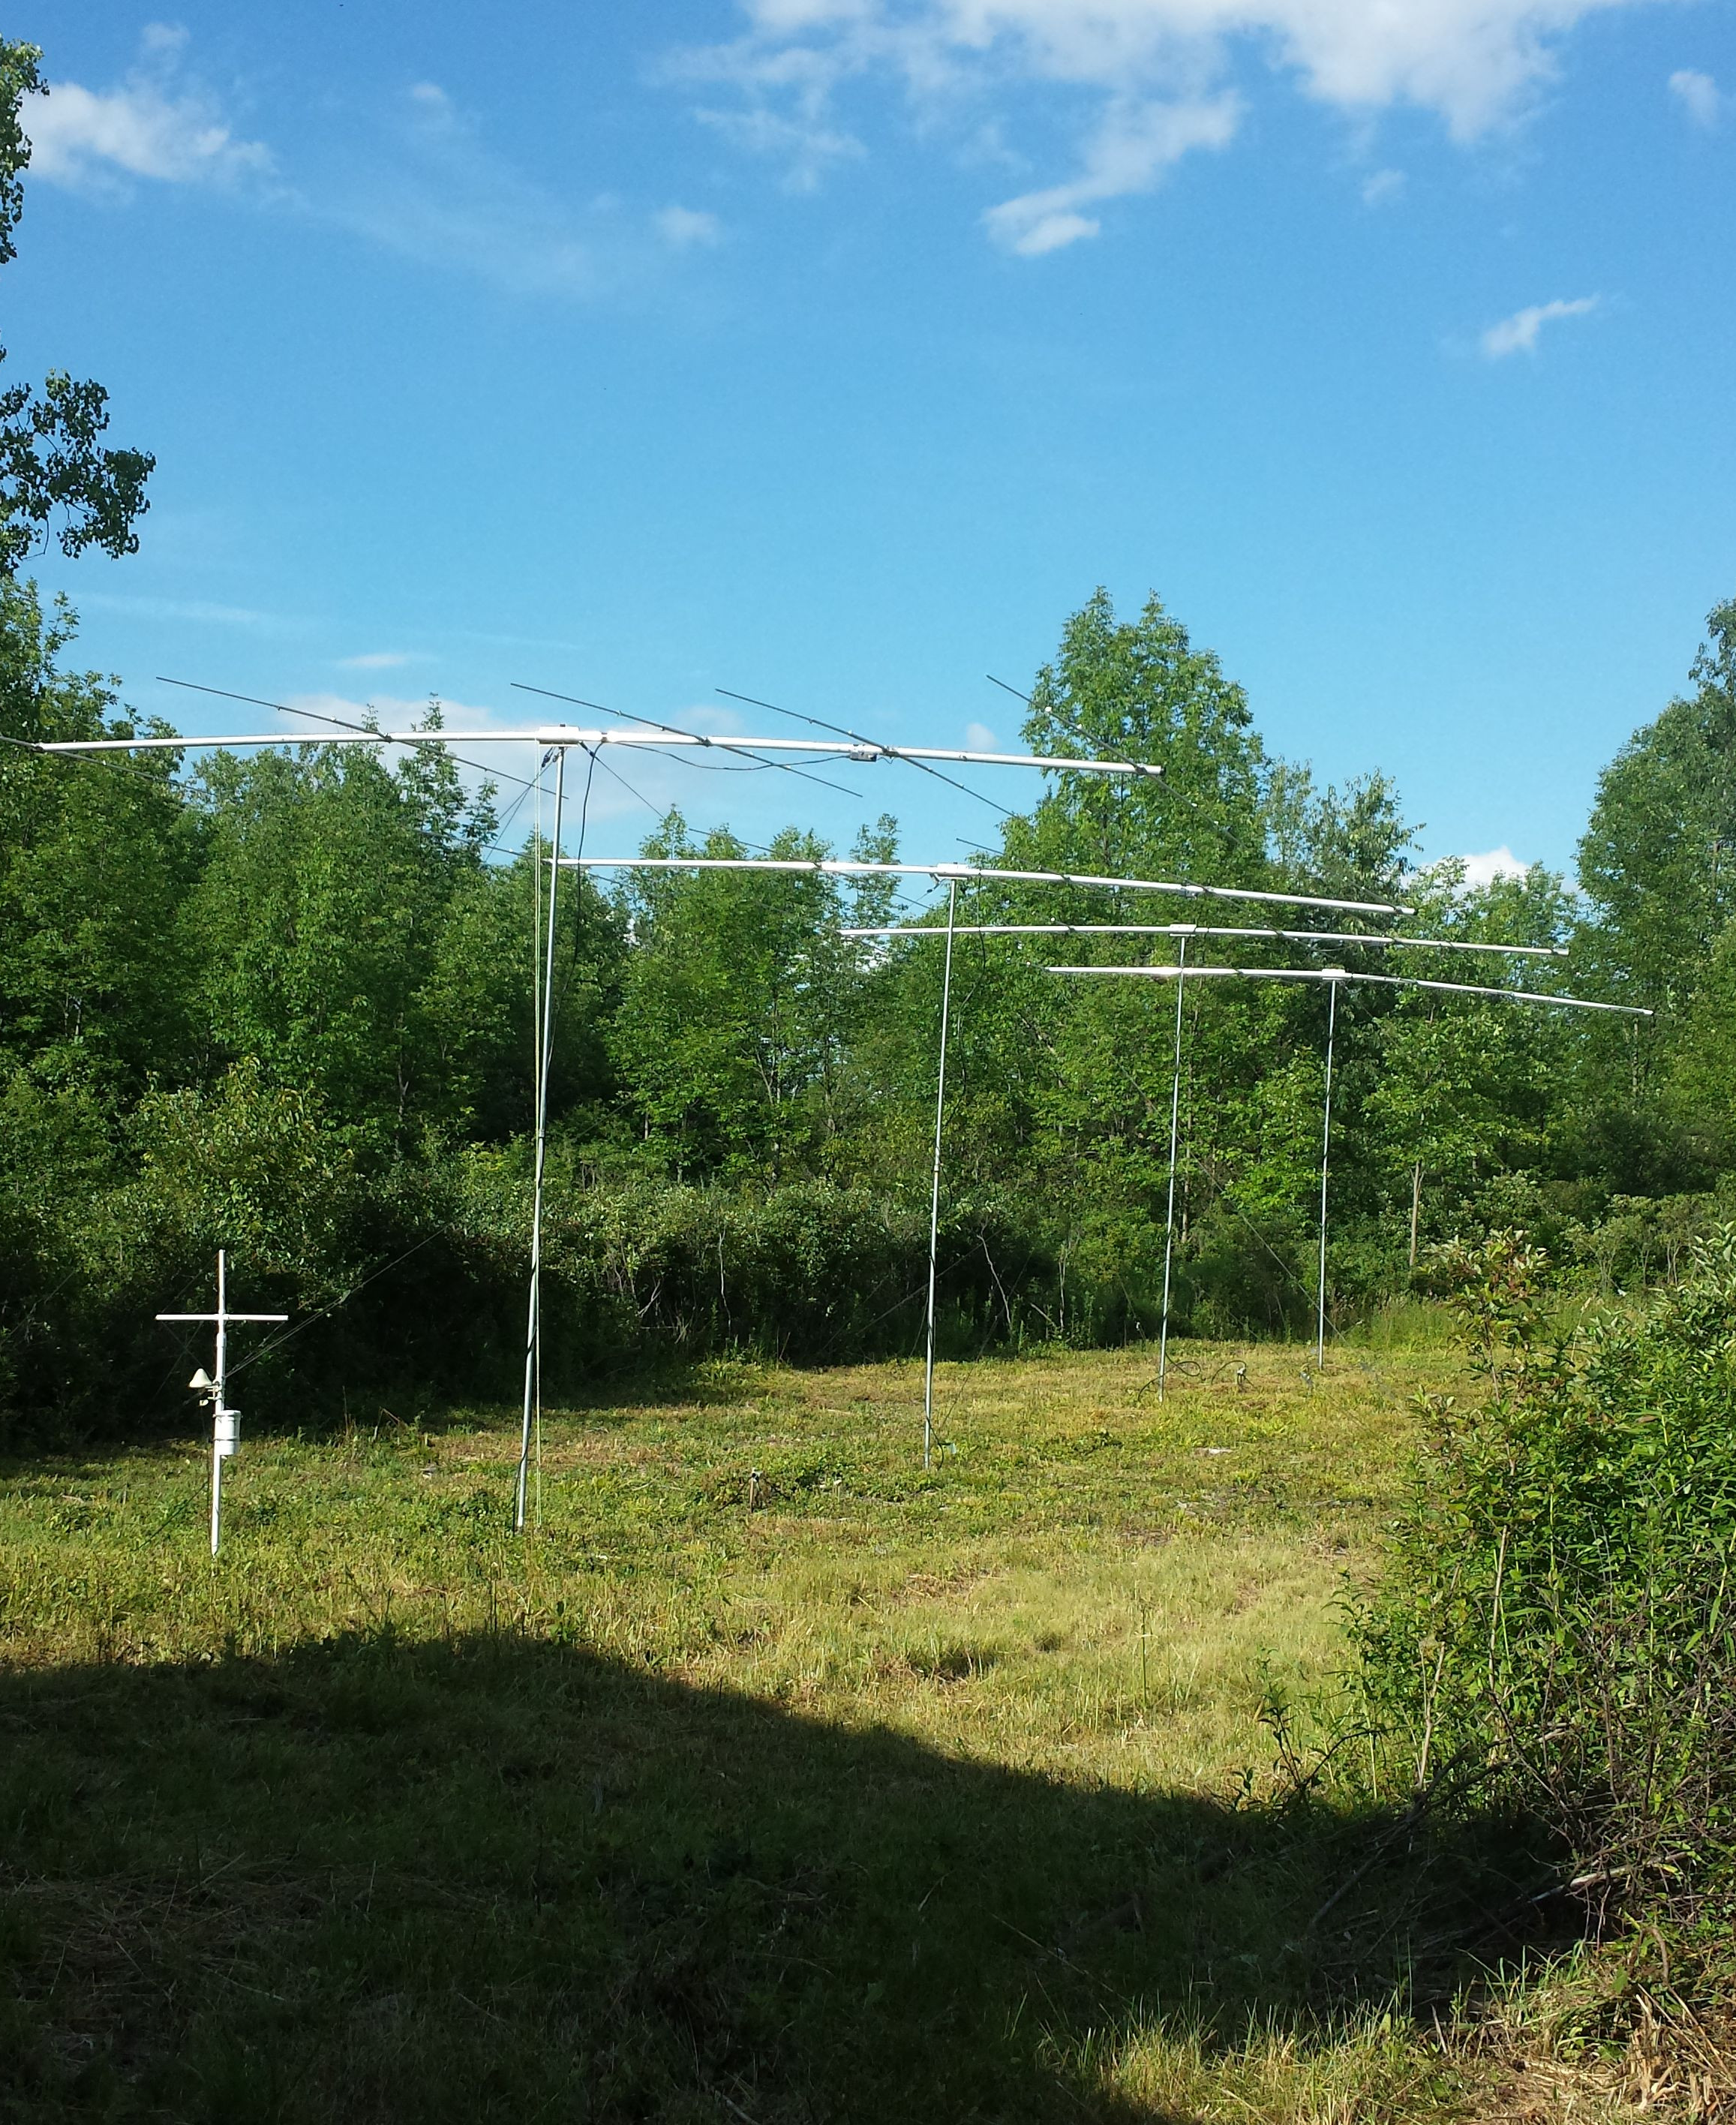
The Imaging Radar Interferometer at Zeman Laboratory is located on the grounds of the Cornell Botanic Garden at a site once used for the development of hardware destined for the Arecibo Radio Observatory in Puerto Rico. The radar is used to observe meter-scale field-aligned plasma density irregularities in the E region ionosphere over the Great Lakes region. The irregularities inhabit so-called sporadic E ionization layers made mainly from metallic ions. Similar irregularities are observed widely at middle latitudes where they occur in long bands spaced by tens of kilometers and propagating predominately to the southwest in the northern hemisphere. The bands are thought to be associated with neutral dynamic instability in the mesosphere/ lower thermosphere although various plasma instabilities may also be involved. Sporadic E layers and the attendant irregularities also occur at higher latitudes approaching the ionospheric trough but have received less attention until now.
The sporadic E-layer irregularities are connected by magnetic field lines with F-region irregularities associated with so-called midlatitude spread F. The field of view of the Zeman radar is overlooked by the Millstone Hill Observatory in Westford, Massachusetts, which can detect midlatitude spread F using incoherent scatter radar techniques. In addition, a coherent scatter radar located in Clemson, South Carolina, the twin of the Zeman radar, can detect F-region field-alligned irregularities via coherent scatter. Together with other instrumentation nearby, the radars will be used for a comprehensive investigation of instabilities and irregularities at the edge of the midlatitude ionosphere.
A key feature of the Zeman and Clemson radars is their implementation of radar imaging techniques. Radar imaging provides a volumetric view of the scatterers under investigation. The images have a cadence of approximately once every three seconds, a range resolution of 1.5 km, and an angular resolution of approximately 0.5 degrees. Doppler spectra are imaged as well. The radars provide unambiguous information about the spatial, temporal, and dynamic structure of the underlying waves and instabilities.
Quasiperiodic echoes
We asscoiate QP echoes with neutral atmospheric instaibility in the MLT driven by turning wind shears. The turning shears form the sporadic-E layers, and the billows that result from dynamic instabiliy form fronts or rolls in the ionization from which QP-echoes arise. Secondary instabilities emerge along the billows and rolls at late stages of the process. The simulation at right depicts the time evolution of electron density isosurfaces in a volume 40 km x 40 km wide and 5 km high. The simulation is initialized by winds in the form of an Ekman spiral. Rolls that form in the simulation propagate toward the viewer which is toward the southwest. See Hysell and Larsen, 2025.
Representative data
| UT Date | CSR RTI | images | images | images | MHO data | Ionogram |
|---|---|---|---|---|---|---|
| Jul. 16 2020 | r200716.pdf | s200716.mp4 | 0145 UT | |||
| Jul. 19 2020 | r200719.pdf | 0022 UT | ||||
| Aug. 5 2020 | r200805.pdf | s200805.mp4 | 0130 UT | |||
| Aug. 11 2020 | r200811.pdf | s200811a.mp4 | s200811b.mp4 | s200811c.mp4 | 0052 UT |
| UT Date | CSR RTI | images | images | images | MHO data | Ionogram |
|---|---|---|---|---|---|---|
| Jun. 1 2021 | r210601.pdf | s210601a.mp4 | 0130 UT | |||
| Jun. 14 2021 | r210614.pdf | s210614.mp4 | 0130 UT | |||
| Jun. 19 2021 | r210619.pdf | 0130 UT | ||||
| Jun. 28 2021 | r210628.pdf | s210628b.mp4 | s210628c.mp4 | 0200 UT | ||
| Jun. 29 2021 | r210629.pdf | s210629.mp4 | 0200 UT | |||
| Jun. 30 2021 | r210630.pdf | s210630a.mp4 | s210630b.mp4 | 0300 UT | ||
| Jul. 2 2021 | r210702.pdf | s210702a.mp4 | s210702b.mp4 | ne2021-07-01.png | 0200 UT | |
| Jul. 7 2021 | r210707.pdf | s210707.mp4 | 0300 UT | |||
| Jul. 23 2021 | r210723.pdf | s210723.mp4 | 0300 UT | |||
| Jul. 30 2021 | r210730.pdf | s210730.mp4 | ne2021-07-29.png | 0030 UT | ||
| Jul. 31 2021 | r210731.pdf | s210731.mp4 | 0100 UT | |||
| Aug. 5 2021 | r210805.pdf | s210805.mp4 | 0130 UT | |||
| Sep. 1 2021 | r210901.pdf | s210901a.mp4 | s210901b.mp4 | 0100 UT |
| UT Date | CSR RTI | images | images | images | MHO data | Ionogram |
|---|---|---|---|---|---|---|
| Jun. 12 2022 | r220612.pdf | s220612.mp4 | 0215 UT | |||
| Jun. 13 2022 | r220613.pdf | s220613.mp4 | 0200 UT | |||
| Jun. 14 2022 | r220614.pdf | s220614.mp4 | 0200 UT | |||
| Jul. 7 2022 | r220707.pdf | 0300 UT | ||||
| Jul. 8 2022 | r220708.pdf | |||||
| Aug. 15 2022 | r220815.pdf | s220815a.mp4 | s220815b.mp4 | 0000 UT |
| UT Date | CSR RTI | images | images | images | MHO data | Ionogram |
|---|---|---|---|---|---|---|
| May 29, 2023 | r230529.pdf | s230529.mp4 | 0300 UT | |||
| Jul. 9, 2023 | r230709.pdf | s230709.mp4 | 0300 UT | |||
| Jul. 10, 2023 | r230710.pdf | 0300 UT | ||||
| Jul. 19, 2023 | r230719.pdf | 0300 UT | ||||
| Jul. 30, 2023 | r230730.pdf | 0330 UT | ||||
| Jul. 31, 2023 | r230731.pdf | s230731.mp4 | 0100 UT |
| UT Date | CSR RTI | images | images | images | MHO data | Ionogram | May 11, 2024 | r240511.pdf | s240511.mp4 |
|---|---|---|---|---|---|---|
| June 26, 2024 | r240626.pdf | s240626_1.mp4 | s240626_2.mp4 | June 27, 2024 | r240627.pdf | s240627_1.mp4 | s240627_2.mp4 | July 10, 2024 | r240710.pdf | Oct. 11, 2024 | r241011.pdf | s241011_1.mp4 | s241011_2.mp4 |
Gallery